The weather getting warmer, schools starting to close, and folks starting to spend more time outside all point to the same thing: summer is quickly approaching. For the mortgage industry, this also means that the busiest period of the year is about to begin. About two years ago, we looked into mortgage quote seasonality from 2009 – 2014 to see just how much of a “busy period” the summer months really were compared to the rest of the year. Those numbers looked like this:
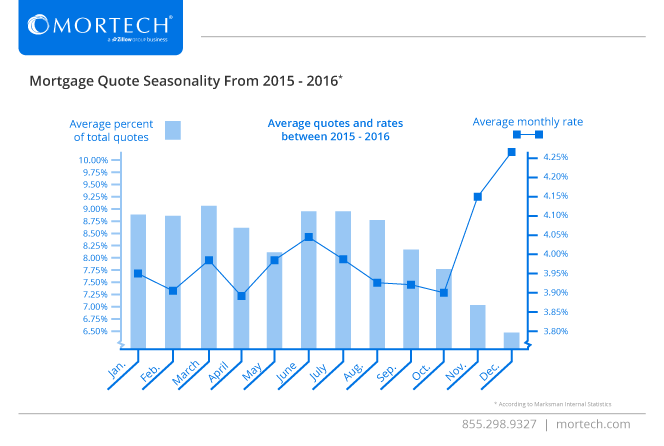
With two years now passed since then, we wanted to pull the numbers from 2015 and 2016 to see if things had stayed consistent, or if they’d changed, and look into why any changes (or non-changes) had occurred. Here’s what we came up with:
Comparing the two charts together, two conclusions can be drawn. The first is that rates are still the determining factor in volume. Notice that from 2009 to 2014 rates were significantly higher than from 2015 to 2016, and as a result, the overall percentage of yearly quotes for the first third of the year went up. This caused a much more balanced graph in the last two years than the five years prior, which saw a steady decline in rates from the year’s start to its end.

.jpg)