Mortgages have come a long way since 2007. After the housing bubble burst, many wondered if the market would ever recover, and if it did, how long it would take? Now, a little over six years have passed since the U.S. Treasury announced it would be providing unlimited support to Fannie and Freddie, despite the huge losses at the time. We can now look back at what the market’s recovery has looked like.

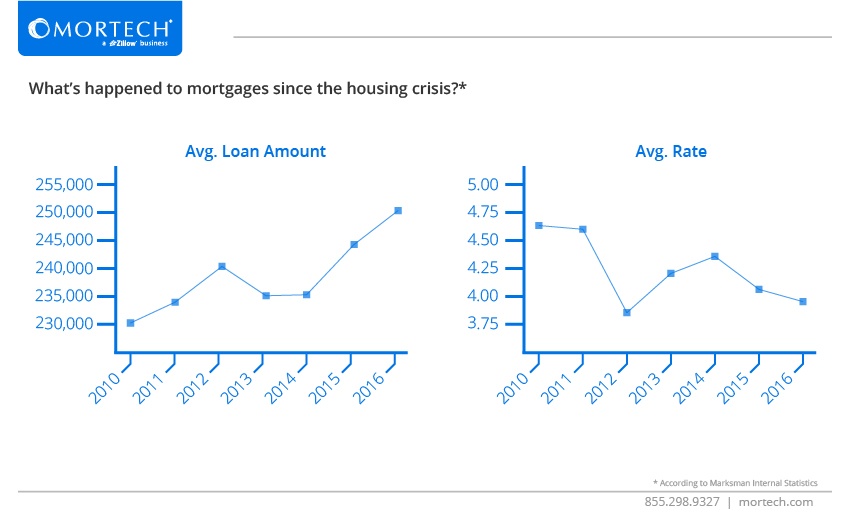
The correlation of data is pretty straightforward – as rates began to decrease in 2010, the average loan amount for the year trended upward, and after 2012 when rates went on a two-year climb, average loan amounts responded by dropping. It’s interesting to note that other than the drastic change in 2012, which led to a responsively less ideal next two years, the data was pretty consistent in trending one direction. Even when rates had risen for the second straight year in 2014, they were still lower than 2011 or 2010, and when they began to drop again in 2015 and 2016, average loan amounts shot up to the highest they were in the entire period.
With interest rates up substantially since November of last year, it’ll be interesting to see what 2017 looks like plotted on these charts, and if we’ll see an end to the two-year drop rates have been on. Time will tell.
However, regardless of where rates are at, you won’t be able to bring in borrowers if you can’t get your rates in front of them. Fortunately, Mortech’s mortgage pricing engine can provide you with fully automated pricing engine functionality at the click of a button, and allow you to automatically post your rates online to thousands of online borrowers across different marketplaces. To find out more, contact us today for a free demo and find out what Mortech can do for you.


